

Conoce el método de MapBiomas Alerta
MapBiomas Alerta Perú es una iniciativa colaborativa que transforma alertas tempranas de deforestación en datos verificados, exactos y con contexto. El procesamiento de este conjunto de alertas implica una validación rigurosa, el refinamiento de límites cartográficos utilizando imágenes satelitales de alta resolución (Planet Scope con resolución espacial de 3.7 m), la generación de informes detallados y la publicación de los resultados finales en una plataforma única de acceso abierto ( https://plataforma.peru.alerta.mapbiomas.org/ ).
DESCRIPCIÓN DE LOS PASOS
El proceso de MapBiomas Alerta Perú abarca los siguientes pasos: compilación, validación, refinamiento, cruce de referencias con datos públicos, auditoría y publicación de alertas e informes de deforestación (Figura 1).
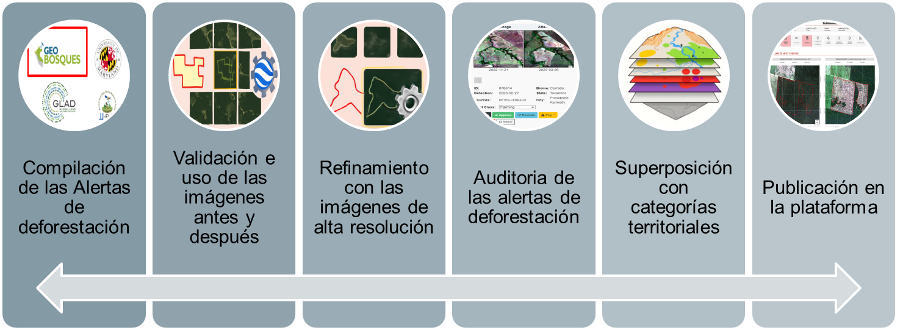
Figura 1. Proceso metodológico de MapBiomas Alerta Perú para compilar, validar, refinar, cruzar datos, auditar y publicar alertas de deforestación en Brasil
Paso 1: Se recopilan las alertas elaboradas para el bioma amazónico, se organiza y se consolida la información de las alertas tempranas de deforestación provenientes del sistema de monitoreo oficial en Perú. Este sistema utiliza imágenes satelitales Landsat con resolución de 30 metros para detectar y generar alertas de deforestación .
Paso 2: Validación y selección de imágenes antes y después
El proceso de validación se realiza en dos etapas. La primera es automática, eliminando todas las alertas de deforestación que son menores a 1 hectárea. La segunda etapa consiste en una inspección visual por analistas entrenados, organizados en equipos, apoyados en mosaicos mensuales de imágenes de alta resolución de la constelación Planet (con resolución de 3,7 metros) y Sentinel 2. En esta fase, también se pueden descartar alertas que resulten ser falsos positivos, registrando la razón del rechazo. Las razones comunes de descarte incluyen
- Agricultura: Alertas generadas por actividad agrícola preexistente.
- Degradación: Pérdidas naturales, actividad forestal (caminos transitorios, tala), o eventos de degradación.
- Alterado anteriormente: Áreas que ya habían sido impactadas previamente (cambio de uso en No Bosque).
- Sombras de relieve: Detecciones causadas por la sombra de la orografía.
- Cambio de estación: Variaciones estacionales (sequía/humedad) o cambios en el nivel del agua de ríos que generan falsos positivos.
- Incendios/quemas: Incendios forestales que no necesariamente causan un cambio de uso del suelo.
- No disponibilidad de imágenes: Ausencia de imágenes claras debido a nubosidad u otras interferencias.
- Reforestación: Alertas causadas por la tala de plantaciones forestales.
- Duplicado: Alertas cartográficas y temporalmente superpuestas.
Solo cuando la inspección visual confirma el evento de deforestación antrópica, la alerta se considera pre-aprobada. A partir de ese momento, se seleccionan los pares de imágenes satelitales de alta resolución (una que muestra la vegetación nativa antes y otra después de la deforestación) que pasarán a la siguiente etapa.
Paso 3: Validación y refinamiento en imágenes de alta resolución
Una vez que las alertas han sido pre-aprobadas y las imágenes de alta resolución seleccionadas, se procede al refinamiento de los límites espaciales. Este paso es crucial para delimitar con mayor precisión la zona efectivamente deforestada.
El refinamiento puede realizarse de dos formas:
- Automática: Utilizando algoritmos avanzados como Random Forest, el sistema clasifica el área de cambio basándose en muestras de entrenamiento de las imágenes de alta resolución (zonas deforestadas y no deforestadas). Luego, los resultados finales se convierten en un polígono refinado, que pasa por un proceso de simplificación para eliminar vértices excesivos.
- Manual: En casos complejos, los analistas pueden dibujar manualmente el polígono del área deforestada, utilizando la capa de “No Bosque acumulado” como referencia no condicional.
Durante este proceso, el analista también identifica y registra la causas de la deforestación, tales como agricultura, minería, ganadería, infraestructura vial, expansión urbana, entre otros.
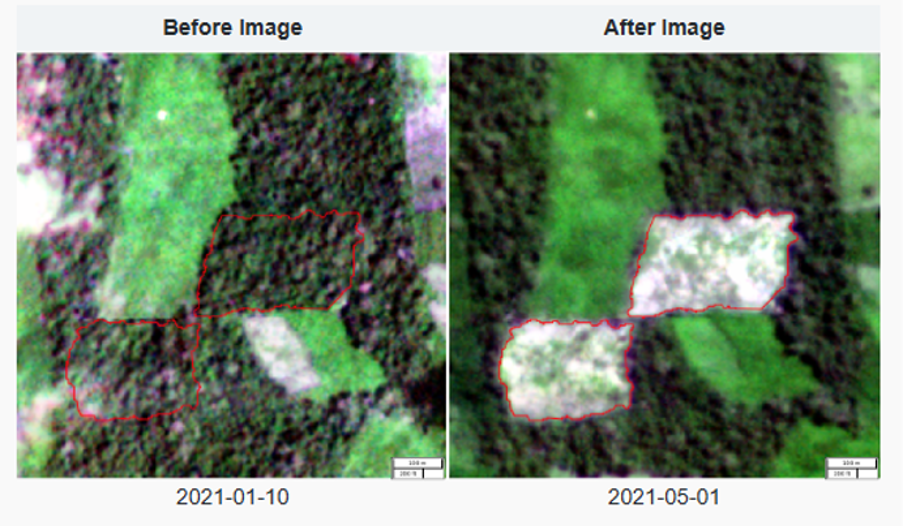
Figura 2. Ejemplo de imágenes de Planet antes y después de la deforestación, junto con el polígono de alerta refinado
Paso 4: Auditoría
Cada polígono refinado pasa por un proceso de auditoría realizado por el supervisor técnico. En esta etapa, se evalúa la eventual necesidad de realizar ajustes adicionales antes de la publicación final de la deforestación confirmada.
Paso 5: Cruces con bases de datos territoriales públicas
Los polígonos refinados se superponen espacialmente con información de las categorías territoriales, incluyendo comunidades nativas, reservas indígenas, comunidades campesinas, área natural protegida, zonas de amortiguamiento, área de conservación regional, área de conservación privada, ecozonas, ecosistemas frágiles, entre otras. Las alertas también se vinculan a límites administrativos a nivel distrital, provincial y departamental. Estos cruces califican las alertas y permiten la generación de informes técnicos basados en información relevante para las instituciones usuarias.
Paso 6: Publicación
Todos los polígonos de deforestación confirmados se publican en la Plataforma MapBiomas Alerta Perú, con actualizaciones semanales. Los informes están disponibles para cada deforestación confirmada (con área mayor a 1 ha) y para cada cruce de alerta con una categoría territorial. Los informes contienen la siguiente información:
- Código de la alerta de deforestación;
- Fuente original de la alerta (sistema de detección);
- Bioma, departamento, provincia y distrito;
- Área de deforestación;
- Imagen y fecha del antes de la deforestación;
- Imagen y fecha del después de la deforestación;
- Superposición de la deforestación con: comunidades nativas, reservas indígenas, comunidades campesinas, área natural protegida, zonas de amortiguamiento, área de conservación regional, área de conservación privada, ecozonas, ecosistemas frágiles, entre otras;
- Historial de cobertura y uso del suelo de MapBiomas colección 3;
- Historial de imágenes Landsat para el área evaluada;
- Fuentes de datos utilizadas en el cruce espacial.
Cancelación y Corrección de Alertas Post-Publicación
En ciertas circunstancias, las alertas publicadas en la Plataforma MapBiomas Alerta Perú pueden ser corregidas o incluso canceladas. Siempre que exista una indicación formal o una solicitud fundamentada que señale posibles errores asociados con las alertas, ya sea por parte de agencias ambientales o usuarios de la plataforma, el equipo técnico realiza un análisis exhaustivo de dichas alertas.
Este análisis se lleva a cabo revisando las imágenes de Planet y, cuando es necesario, diversas fuentes complementarias, como imágenes de otros satélites (Sentinel, Landsat, etc.), imágenes satelitales de alta resolución disponibles en Google Earth y la Cartografía de Uso y Cobertura de Suelo de MapBiomas. En los casos en que se confirme que la alerta publicada no corresponde a un evento real de deforestación o conversión de bosque (independientemente de la extracción de madera, legalidad o responsabilidad), la alerta se cancela. Esto implica que se elimina del mapa y de las estadísticas de la plataforma, pero permanece en la base de datos para consulta individual mediante su código identificador único.
LIMITACIONES DEL MÉTODO
Como todo método, MapBiomas Alerta tiene algunas limitaciones que deben considerarse al aplicar sus datos:
- Tiempo de procesamiento: La importación de alertas (sistemas de detección) se realiza mensualmente. Parte del proceso de validación y procesamiento se realiza de forma individual y visual por analistas capacitados, por lo que el tiempo de validación y procesamiento puede variar según el bioma y la época del año. Este período puede oscilar entre 30 a 60 días desde la detección por el sistema fuente hasta la publicación en la plataforma MapBiomas Alerta. El objetivo de MapBiomas Alerta Perú es aumentar la certeza sobre los datos de deforestación confirmados y ofrecer informes listos para la vigilancia remota. Las operaciones de vigilancia rápida en campo, dirigidas a detectar deforestación flagrante, pueden ser planificadas directamente con los sistemas de detección existentes.
- Omisiones en las alertas: La deforestación se valida y refina con base en la existencia previa de una alerta captada por un sistema externo de detección. Las posibles omisiones de estos sistemas en la detección de deforestación también afectan las alertas evaluadas por MapBiomas Alerta Perú.
- Subestimación de la velocidad de deforestación: Al validar y refinar una alerta, se realiza la búsqueda de un par de imágenes de satélite Planet de buena calidad, de antes y después de la deforestación. La imagen del “antes” es la más reciente en un período de hasta 6 meses antes de la detección, y la del “después” es la más cercana al fin del proceso de deforestación. La presencia de nubes puede incrementar el período entre ambas imágenes durante días, semanas e incluso meses. Esto no altera la afirmación de que el evento de deforestación ocurrió en el período entre las dos imágenes, pero sí puede afectar el cálculo de la velocidad promedio con la que ocurrió la deforestación realmente.